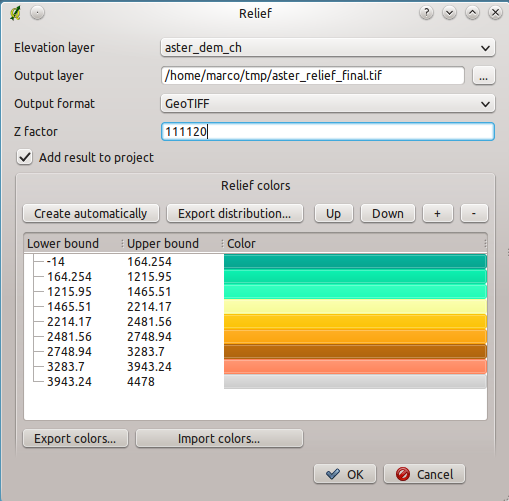
Creating a shaded relief map from digital elevation data is a nice way to create a backround map for web mapping or other GIS work. Thanks to the know-how and the funding from the Swiss Humanitarian Aid Unit, QGIS now has a sophisticated function for relief map generation. The method is described in detail in an paper by Marc-André Bünzli. An important part of the method is the choice of the elevation colors. The QGIS plugin has the possibility to analyse the frequency distribution of the elevation values in the DEM and to propose color changes where significant changes in the histogram occure. It is of course also possible to modify the color scheme, to insert a completely different one in the dialog or to generat a shaded maps without color.
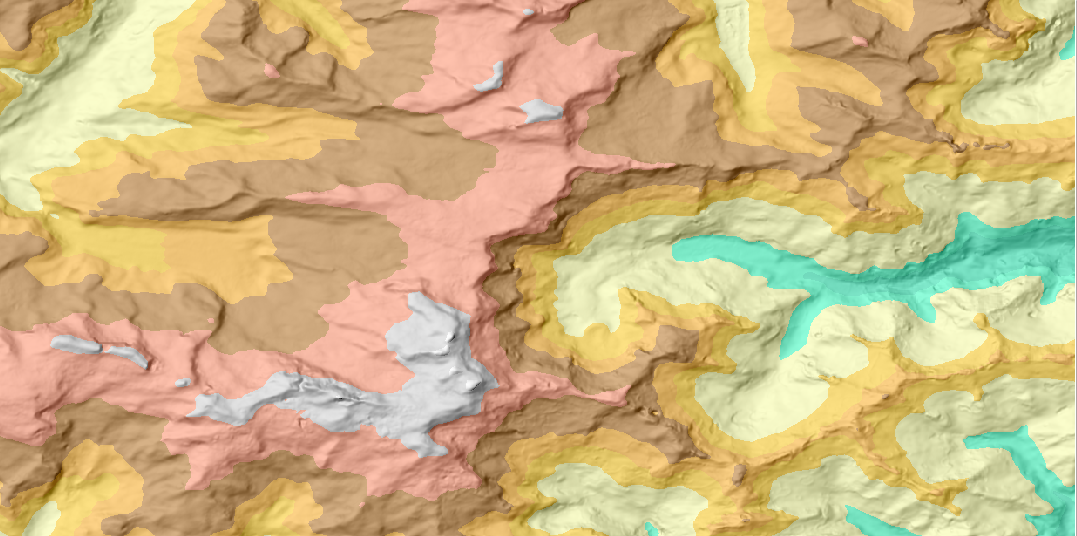
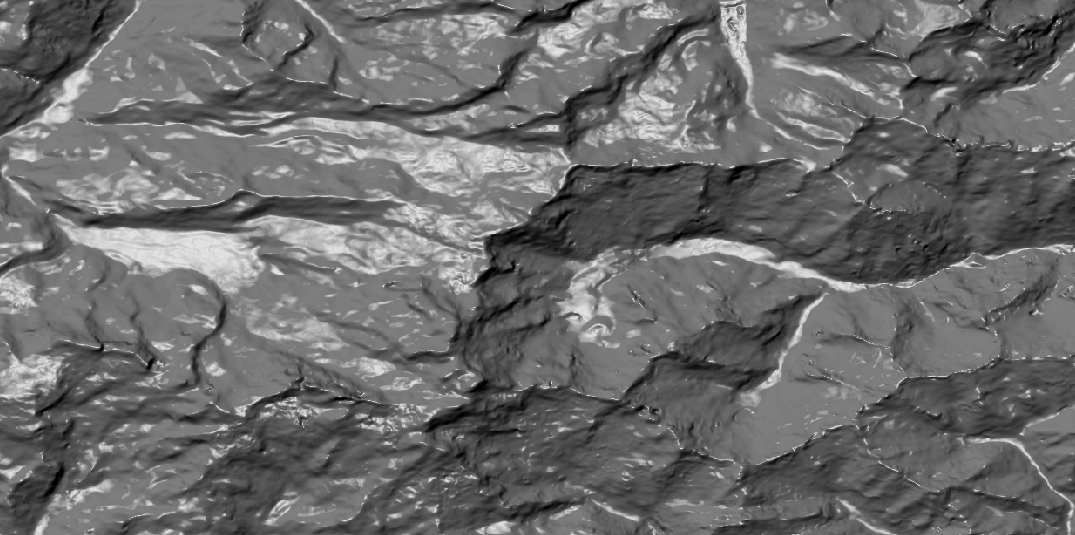
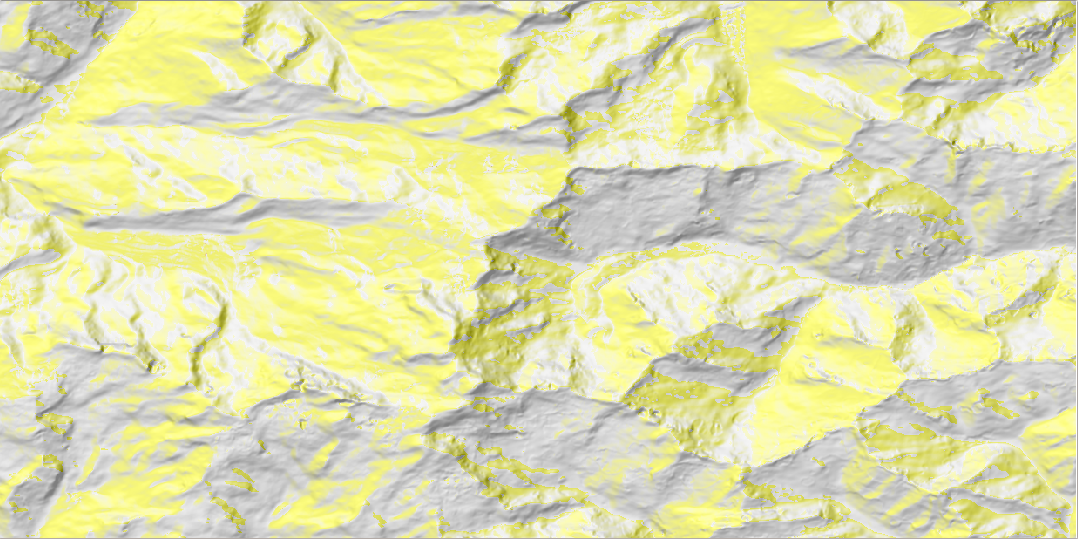
As illustrated below, the relief map is composed by three components modulated onto the final map to give it a more three-dimensional appearance. These intermediate steps are shown here to get a better understanding of the method. In QGIS, the user directly gets the combination as a result.
- The first component consists of a hillshade from north-west (300 degree) and an elevation color
- The second component is a hillshade and a gray value depending on the slope angle (darker is steeper). The hillshade angle of this second component differs to the first component by 15% to have better contrast in faces towards the light source. The second component is merged to the relief map with 30% weight.
- The third component consists of a hillshade from 270 degree and a yellow color in cells facing towards the light source. It is merged to the relief map with 10% weight
And the final relief map looks like this:
